INscope – analyze the trace
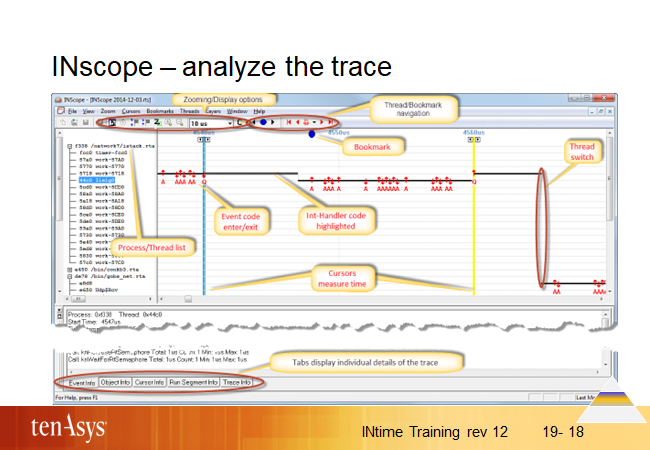
The main screen is made up of 3 areas:
-
Threads pane on the left side. Displays a list of processes/threads.
-
Trace pane on the right side. Displays events of the threads that executed during the trace on this node. Left/right-clicks populate the tabs in the info bar.
-
Info bar with tabs at the bottom. Displays details selected or clicked in the threads- and trace pane.
Execution of every thread is displayed in the trace pane on its individual timeline allowing correlation of interrupts, system calls and user events with the application executing on the node.
Processes and threads are displayed with user defined names when cataloged in the object directories.
Each thread is displayed as a horizontal line, which is solid when the thread executes. Whenever a thread switch occurs, the reason is shown.
The trace can be annotated during analysis and may be forwarded to coworkers for finer grained analysis. The windows side of INscope does not require a license thus traces and INscope can be shared with respective specialists.