INscope – API
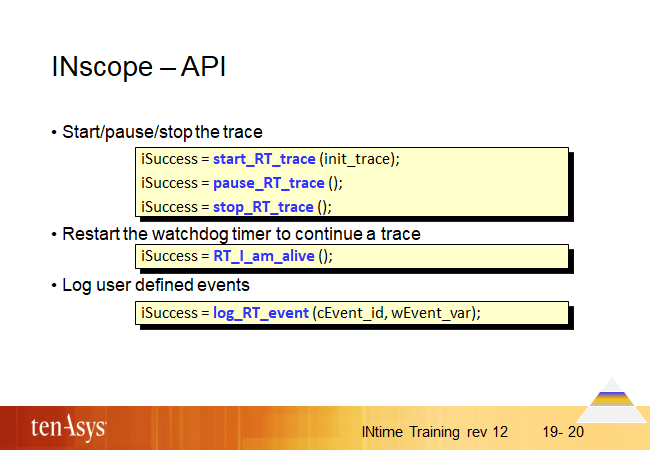
The API allows precise control of capturing the configured events in the trace as well as adding application specific information into the trace.
Most common is logging user defined events with an ASCII character cEvent_id identifying the source of the event and a 16-bit value wEvent_var coding additional information for this Event_id. User defined events also can be used in interrupt handlers to diagnose specific situations.
A user event helps to structure the traced information. The Event_id can also be searched in INscope with “Quick Search”. If you instrument your code with user defined events, you may be able to verify correct flow of activities according to your application logic by looking into the trace. Filtering the layers to display only user defined events further helps to analyze the traced data.
Use the start/pause/stop calls to only capture trace information in specific situations to diagnose them.
The watchdog timer can be used to diagnose why a thread did not provide results within an expected amount of time. It stops a trace saving the most recent events in case the watchdog timer did not get the RT_”I_am_alive” call in time.