INscope – Server config and display options
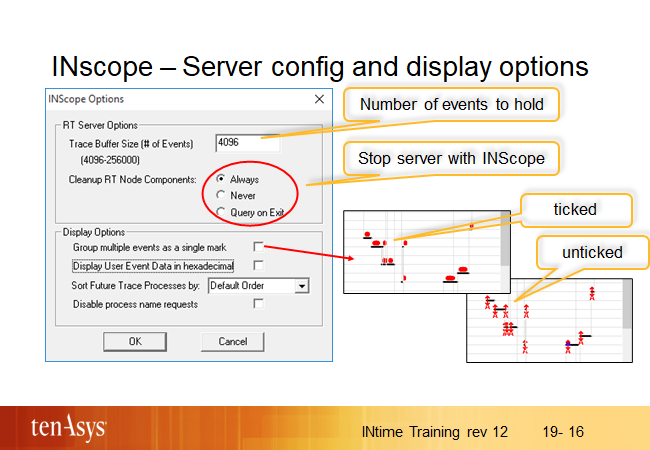
General options for the INscope RT-side server and display of traced events on Windows are configured in INscope à View à Options. An individual trace session is configured with the start of a new trace.
INscope‘s GUI (running on Windows) uses a realtime server on INtime to capture events and trigger the start/pause/stop of a trace. The size of the cyclic buffer can be configured – and will use respective memory on the INtime target. The RT server will be automatically loaded and started by INscope. When a long running trace is configured and started, INscope can be closed. For such cases configure that the server shoud not cleanup but continue to run.
Display uptions allow to group events so that individual events do not overlap when zooming displays a long section of execution. For future traces, the sort order for Processes can be specified. By default, processes are displayed in the order that they first run in the trace.
The sort order of already completed traces is configured by a right-click at the top of the process/thread list.