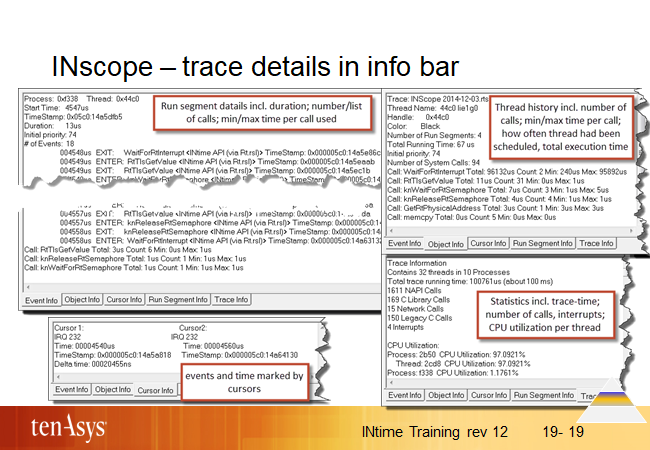
INscope – trace details in info bar

Here we show some examples.
The details displayed in the info bar are context sensitive and depend on the object you select, or area selected in the thread and trace pane. We encourage you to start analyzing a trace by experimenting with INscope’s GUI.
A good start is by working through Example #4 of the Quick Start Guide. You also can enhance the project described in Example #4 by user defined trace information described on the next slide.